
Import coordinate table with Manifold GIS
 Previously we have seen different functionalities of Manifold, in this case we will see how to import existing coordinates into an excel file.
1. The data
The graph shows the work of dismemberment that must be done in a building.
There are other ways to do this procedure, one of them is to import data directly from the gps through the console that includes Manifold, but in this case we will assume that the data is emptied into an excel file.
It is also practical to do this when there are many points captured or differential correction has been made to the data obtained.
2 Import the coordinate table
 This is the table that contains the coordinates of the five points to be graphed. The first column contains the number of the point and the others the coordinates in UTM.
Manifold allows you to import or link tables from formats cvs, txt, xls, dbf, dsn, html, mdb, udl, wk, or from ADO.NET, ODBC or Oracle data sources.
 So in this case, I only make the association.
File / link / table
And I choose the file
When importing, Maifold shows me a panel where I must define the type of delimiter: if it is an excel file, it will be necessary to choose "tab", as well as the thousands separator and if the data to be imported I want them as text.
I can also indicate if the first line contains the name of the field.
Now you can see how the table has been left in the component panel.
3. Convert the "table" into "drawing"
 What is required is to convert this table into a "drawing" and tell Manifold which columns contain the coordinates. So the table is selected in the component panel, then the right mouse button is chosen and "copy"
Now right click and "paste as" by choosing the "drawing" option and in the panel that appears it is indicated that the column 2 contains the coordinates "x" and the column 3 the coordinates "and"
Then the component created is assigned projection, so I indicated that it is UTM Zone 16 North, and that's it, when you drag it to the drawing you can see the points in the indicated area.
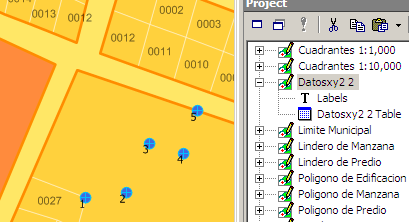

4. Show the data of each point.
If you observe, I have created a label with the first column of the points, and I have changed the default format. This is done by touching the component in the right panel, and selecting the "new label" icon, indicating that the first column is the one I want to turn into a label.
It could indicate another type of data, if it wanted it doing double click in the column, that can be not only those of the table but those associated to the geometry of the elements.
5. Other alternatives
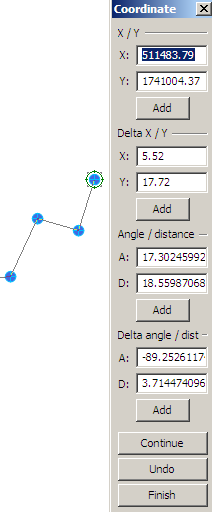 If there are few data, Manifold has a panel for entry using the keyboard: to activate the object to create (point, line or shape), the first point is placed on the screen, then the keyboard button is activated " insert "and this table facilitates the entry of data in different ways:
- X, Y coordinates
- Delta X, Delta Y
- Angle, distance
- Deflection, distance
Not bad for the first case, while the angle-to-date approach has not managed to configure an option other than decimal angles ...
the alternative of entering azimuth is on the wish list of the Manifold 9x version


