
Understanding the UTM projection
Many people are constantly asking how to change geographic coordinates to UTM. We are going to take advantage of the solitude of this hotel and explain with what we have at hand how the UTM projection works to get rid of some basic doubts.
I recommend if you already master the subject, don't waste your minutes getting bored ... but you can link us to your blog :). It is not the purpose of this post to talk about projections, for that there are many other articles, basically it is interesting to explain the handling of coordinates, we will use Google Earth to show the examples.
Geographic coordinates
Geographic coordinates come from dividing the globe into segments as we would an apple, vertical cuts made by meridians (called longitudes) and horizontal cuts made by parallels (called latitudes).
To enumerate the latitudes is part of the equator, north or south from zero to 90 degrees at the poles and these two halves are called hemispheres.
In the case of longitudes, these begin to be listed from the Greenwich meridian called the zero meridian to the east, they are listed until reaching 180 degrees, where this same meridian divides the earth (called antemeridian), this half is called " East". Then the other half is called West, generally represented by the W (west), the meridians still start from Greenwich but in the opposite direction from zero to 180 degrees.

Thus a coordinate in Spain can be Latitude 39 N and length 3 W, a coordinate in Peru would be Latitude 10 S and length 74 W.
This way of determining the coordinates that does not have to do with an altitude above sea level, since it is a vector that starts from the center of the earth towards the surface, this is the projection that Google Earth uses, and this is the way of coordinates used by the kml files, additionally a reference spheroid is added which is the way to approximate the surface of the earth for measurement purposes. Google uses WGS84 as the reference spheroid (although there are Tools that allow you to enter UTM coordinates into Google Earth). The greatest advantage of this projection is that the coordinate is unique on the surface of the earth, although handling operations to calculate distances or bearings is not practical for "non-geographers".
The UTM coordinates
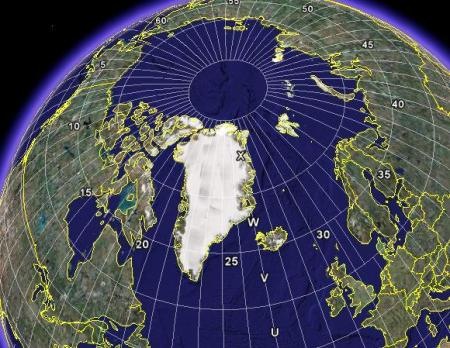
The UTM coordinates start from the idea of considering a reference spheroid at sea level from the cylindrical projection Traverso de Mercator. The earth is always divided by meridians, in segments of six degrees forming a total of 60, these are called zones. The numbering of these areas is starting from the antemeridian, from zero to 60 from west to east.
The segments that generate the parallels go from 84 S to 80 N, and are numbered with letters that go from C to X (“I” and “O” are excluded), each segment has 8 degrees of latitude except the X which has 12 degrees.
The A, B, Y, Z are used especially for the polar ends; Google does not include this segment because it requires an infinitesimal calculation in an area of interest only for polar bears :).
 In total 60 zones are 6 degrees each, as well
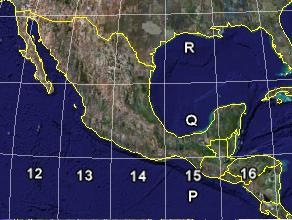
- Mexico falls between 11 and 16 zones
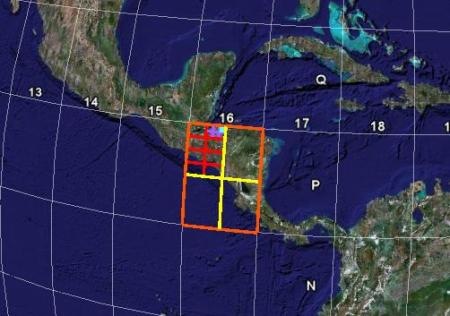
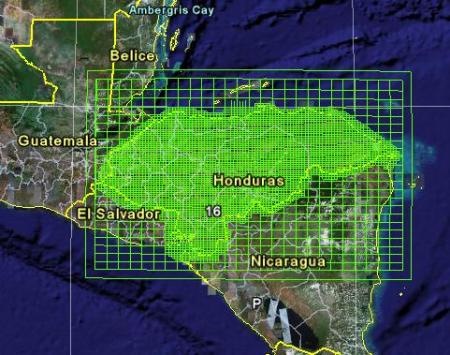
- Honduras in the 16 and part in the 17
- Peru between 17 and 19
- Spain between 29 and 31.
The approximation of the reference spheroid to sea level makes the arc formed by these lines have measurements that are quite similar to the reality of a local measurement. This reference spheroid, previously (popularized in Latin America) was the NAD27, currently the NAD83 is widely used, known by many as WGS84. By having different horizontal reference, the grids of both spheroids are different.
So a zone has a starting x, y coordinate, in the case of Central America, the limit between zones 15 and 16 has an approximate coordinate of 178,000 and goes up to more or less 820,000. This coordinate range is the same for each area, at the same latitude but we clarify, it is not an orthogonal grid but for local measurement purposes, it is quite similar. The boundaries between zones are closing, but everything starts from a central axis, where there is a totally vertical meridian whose length is 300,000 known as "false east", so that both to the left and to the right of this meridian there are no units negative.
The latitude (Y coordinate) starts from 0.00 at the equator and climbs to the north pole with coordinates near 9,300,000.
The maps we know for cadastral purposes, with scales 1: 10,000 or 1: 1,000 Arise from the partition Of this zone, in a post next we will explain how this partition comes.
A geographical coordinate, such as 16N 35W is unique, however a UTM coordinate such as X = 664,235 Y = 1,234,432 equals a point that is repeated in 60 zones at that same latitude, both in the northern hemisphere and in the south; Requires an area and hemisphere to define where it belongs.
Then both coordinates will occupy a reference spheroid. In the case of the UTM coordinate, if it is in NAD27 it will not be equal to WGS84 because the meshes that form the grid are not coincident. To transform UTM coordinates to Geographic coordinates or vice versa, there are applications that facilitate it, such as Geofumed templates.
It is important to understand that CAD systems traditionally did not support a projection, such as AutoCAD or Microstation, only AutoCAD Map3D or Microstation Geographics did (As of AutoCAD 2009 and Microstation 8.9 XM they do). When using a georeferenced map in AutoCAD, with UTM coordinates, what we have is a map within a Cartesian plane, but we must understand that those same coordinates exist in 60 other areas at the same latitude in both the northern and southern hemispheres; hence it becomes complex to work in UTM with properties Which are between two zones.
To interact with the UTM, Google Earth and Excel coordinates, these links can be very useful:
UTM Coordinates in Google Earth


why x has 12 degrees
It depends on what software you have to visualize it.
This coordinate that you need additionally needs the zone, since it is repeated in each of the 60 zones, both in the northern and southern hemispheres.
I have these coordinates and I need to know the location, what should I do
N1300113 E 1040271. THANK YOU
I can not see the image of what you are raising. But you must understand that the utm coordinates are not unique, they are repeated in each zone at the same latitude.
How I am working on a georeferencing I am in the boundary zone between 13 and 14 ,,,. of a file of a city in 13 zone and another file of a city in 14 zone and I paste them in a single file to see how it looks, my question is why they are very far apart when in fact they are almost together? I check it on google earth and everything is perfect, only that they are far away and apparently as if they were in reverse a city of the 13 zone ahead of the 14 when in reality it is not like that
Hi. It will be that you can help me with the following: in the field I usually take points with gps, in UTM and then under data to work a planimetry in AutoCAD, but when wanting to export to the cadastral cartography, only one point appears but not the complete drawing, why is this …… Ecuador
Admirable your patience and generosity in sharing your knowledge, Geofumadas !!
How did mine grids in a mining concession in Bolivia arrive at my 2 points if my letters are in the 56 psad and my coordinates are in the 84 wgs, please help me since with my mobile gps I always go out
Fernando Ojeda February, 2017 at
I wanted to convert to UTM the coordinates of the Popocatepetl volcano which are:
Latitude 19 ° 13'20.00 "
Length 98 ° 37¨40.00 "
And the excel calculation program does not accept the 98 ° length.
How should I proceed if it tells me that I should not go from 80 and 90, when the data is 9
UTM Z14 WGS84
2125458.053 539124.2666 14
You have to use 8 ° 37'40.00 ″ and indicate the other hemisphere
I wanted to convert to UTM the coordinates of the Popocatepetl volcano which are:
Latitude 19 ° 13'20.00 "
Length 98 ° 37¨40.00 "
And the excel calculation program does not accept the 98 ° length.
How should I proceed if it tells me that I should not go from 80 and 90, when the data is 98?
Send to editor (at) geofumadas.com
Can someone help me map the dimensions of a terrain ??? I have the 4 latitude and longitude points. If someone is offering I will send the information that I have and I will thank you very much. Thank you
Hi Bruno.
We are not so clear what you are posing:
Maybe if you detail the situation more: Is it a square what will you do? Is the figure irregular?
Will you partition it on the map?
I'm new in handling gps and maps, they ask me for example to take some points in x, y (4 points) and graph them in a hill, if the area is 4 hectares and that they must be multiples of 100 every x, Y. Please, orient. Thanks (bruficarrasco123-4qoutlook.com)
I would not know how to understand it, depending on the converter you are using. Remember that if the converter has included a fake this, it will never match the normal UTM, which are the ones shown by Google.
Hi. I hope you can help me, because I have tried everything and it does not work:
I'm trying to convert certain geographical coordinates into UTM, using several of the converters that are on the internet. At first I thought it was wrong, but I checked it and in all I get the same.
I am looking for the coordinates of some of the volcanoes in Mexico; I use Google Earth for this and it gives me the geographical coordinates. The problem is that when converting them to UTM, I go from zone 13 to 14 and this totally changes the coordinates, in "x", to such a degree that the snow-capped mountain of Colima (the closest to the Pacific Ocean) shows me a coordinate with 600,000, while the Nevado de Toluca (which is in the center of the country) gives me values of 400,000. I do not understand why.
Thanks in advance
If you explain yourself better, we could try to help you.
I'll give you an example that is nothing more than an illustration for you to understand. Imagine a spheroid passing at sea level, another passing 200 meters up, another passing 1000 meters up. All are a reference spheroid, and a point is equal in each of them but the grid is not, so a UTM point can have different coordinate in different datum
How is the projection utm uses a certain datum
How to calculate the distance in km (scale) in the projection utm
See a point of the area of your interest in Goolgle Earth. If it is north of the equator line, it is zone 17 north. If it is below, it is Zone 17 south.
Hi, could you help me with a question:
Download a DEM that is in WGS84, I need to project it to UTM from my study area that is south west of Colombia (Nariño), the question is, which UTM zone do I use to do the projection, 17n Zone or 17s Zone.
Thank you for your explanation and forgive my ignorance on the subject.
Well, I do not understand.
Send us the UTM coordinate to see, because I can not see the problem well.
Here is an article where you can download the grid of UTM zones in shape file
http://geofumadas.com/construyendo-la-malla-de-una-zona-utm-con-excel-y-autocad/
When I enter the first long, lat fall into the sea, in the Gulf of Mexico. Using WGS84
For the following, which are UTM, occupy define in which zone they are.
Definitely, having so many projections and coordinate systems you need to be defined by whoever took them.
I appreciate the annoyance you take in explaining all this, which I personally consider very commendable and valuable, clarifying, yet there are definitions that you use that I can not understand because of my inexperience. I have a question about the following table that someone introduced me. You could tell me with only this data that presented below, to which coordinate system belong and which datum (if it has) is used. Thanks in advance, I'm waiting.
Longitude East Latitude (X) North (Y)
-92.170660948 19.294503558 587135.5 2133622.5
-92.170643520 19.294488976 587137.4 2133620.9
-92.170620402 19.294469407 587139.8 2133618.8
-92.170618372 19.294467695 587140.0 2133618.6
-92.170614312 19.294464279 587140.5 2133618.2
-92.170610252 19.294460862 587140.9 2133617.8
-92.170597249 19.294449921 587142.3 2133616.6
Where can I download a shape with the grid of utm zones?
Use the geo_utm0.4 converter
Let's see, explain more
What converter did you use?
Do you mean that doing the reverse conversion gives you a different latitude?
Look, use utm converters to degrees and in El Salvador the coordinates are length 89 ° and latitude 13 ° I use zone 16 and northern hemisphere but when converting the meters gives me 89 ° and latitude 2 ° can not be that I do.
Hello, CONAGUA asks me for a “Plan with the measurements and boundaries of the property in UTM coordinates” does anyone know who can provide me with this service?
Very good, now I understand very well.
Excellent POst, continue with this innovative way of teaching those who want to learn or remember these issues.
THANK YOU THIS PAGE OF 10 HELP ME MUCH
THANK YOU
Great contribution, thank you!
UTM units are meters.
The values delivered, what units are ?? I operate algebraically to know the distance between two points and the results is in meters?
I think that directly in AutoCAD can not. Maybe Civil3D has something, but usually you have to convert them.
good
how can I change the lat / lon coordinates to UTM in same autocad I hope you help me in this thanks
It is very good information
Very interesting everything I had forgotten everything now for my daughter I am clearing the brain thanks.
Yes it is a very common problem and a weakness of the UTM system. There are options, but they depend on what purposes are required.
For work purposes, an alternative is to move the false east, meaning, that the central meridian of the zone moves. This is allowed by programs, with the option of modification of projection system.
Another option is to work with latitudes and longitudes in this area, or plots that are affected at the boundary of the area. Then, for printing purposes, it is convenient to give the data in this way so as not to create confusion.
Very interesting and basic in the subject, but my question is: if I have a place to measure and this is located in two geographic areas, as I represent the coordinates utm ?, if I should consider only one area or both?
Or in other words, how do I represent a place that has been measured in a TRANSFER ZONE?
Well I can not understand the whole thing, but you should check the area, because Zacatecas is in the 13 and 14 zones.
If none match the place you expect, the only way to investigate is with whom you took the data, as it might have had a false misconfigured imply that the central meridian of x = 500,000 has a displacement.
That good that there is this space to be able to take doubts, I have been taking grades with co-ordinated utm and this is an example.
Input the coordinates of a plan of a parcel certificate
with this data
X = 636,130.00 y = 2,656,898.00
And I get 24.01828298 -103.6614938
So there we are, the question is:
When the coordinates are x = 507258 y = 2658745
If we are in zacatecas and with the aforementioned coordinates they send me to another state and it is of mountain.
it is assumed that the coordinates that entered are from plots, is the problem that I do not know what kind of gps or utm format they took, as I could investigate the different types of utm and their characteristics.
Thanks for your attention.
I was interesting, but I wish I could see her better on Earth.
Send me this program is re interesntee graxias
Negative, I do not know any
thanks galvarezhn, do you happen to know any program, routine or similar that does what I indicate regarding the union of two zones? I need it for application in autocad.
regards
Hello Ismael
To draw using UTM coordinates in regions that overlap zones, it is necessary to change the false east that is in the center of the zone, this is because the UTM coordinate system was made to see local areas ... and that is a weakness at least under those conditions.
This app is not for that
This program is useful for drawing in autocad between two zones? since the utm coordinates repeat values that the autocad does not understand. I suppose that when entering the geographic coordinates and indicating the zone, the program makes the union of the two zones? in utm coordinates of course
Impeccable, so we can understand where to start.
Systems of reference is one thing and type of projection another.
A cartographic plan must mention both, always.
Excuse me Yorel, it is difficult to be well with everyone, but if you explain to us which of the two you were trying to be a fool we could refer you to other blogs that explain it in a less silly way ... perhaps the level of this blog is not up to you and we understand
... which of the two ... the mirror or the other ...
And do not worry, I knightly understand the meaning of the word troll
What a fool
Names of coordinates
Geographic
This of the coordinates I consider very important because we know where we are located