AulaGEO courses
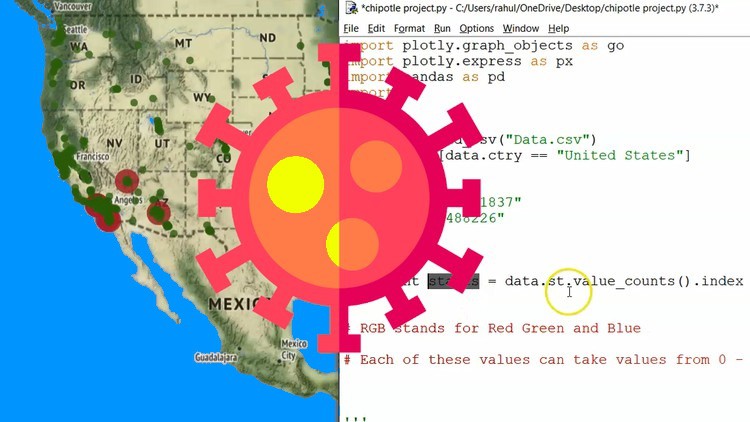
Data Science Course - Learn with Python, Plotly and Leaflet
Currently there are many interested in the treatment of large amounts of data to interpret or make correct decisions in all areas: spatial, social or technological.
When these data that arise daily are analyzed, interpreted and communicated, they are transformed into knowledge. Data visualization can be defined as a technique for creating animations, diagrams, or images for the purpose of communicating a message.
This is a course for lovers of data visualization. It has been elaborated with practical exercises of the current context for its better understanding and application in 10 intensive hours.

What will you learn
- Introduction to data visualization
- Data types and chart types
- Data visualization in Plotly
- COVID display on Plotly
- Plot geographic data on plot
- John's Anger Chart
- Scientific and statistical graphics and animation
- Interactive maps with brochure
Prerequisites
- Basic math skills
- Basic to intermediate Python skills
Who is it aimed at?
- Developers
- GIS and Geospatial Users
- Data researchers


