Use of GIS to control and prevent Dengue
In our Mesoamerican context and the world tropics in general, Dengue is a common disease in the months of the rainy season. Knowing where the greatest number of incidents are occurring is surely an exercise in which GIS applications offer valuable results.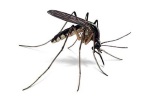
I remember that when I was a child, dengue was not fatal like it is now; barely a week off with fevers, muscle pain, a lot of fluids and the regret of not being able to play a good game of soccer in the mud with friends from the neighborhood. Today it is fatal, if someone does not attend the doctor, they can die in two days in a resounding drop in platelets.
But the dengue problem in urban areas of Mesoamerica is not easy to solve. The cursed insect (Aedes aegypti) lives in clean stagnant waters, so it can be as much in a tire of a vacant lot as in a pot of a plant. Finally, the way to combat it is the destruction of hatcheries combined with fumigation. Without spatial information, this work can be endless and unproductive.
An interesting exercise in the application of Geographic Information Systems to research in health aspects is the case of Taiwan. The objective is to analyze how infected mosquitoes transfer between habitats and, in this way, detect the main transmission corridors between each time period. Therefore, the spatial and temporal dimensions are considered simultaneously.
By establishing an ecological network, researchers can identify the habitat of infected mosquitoes and calculate possible routes of their movement and prevent them from moving through these corridors.
According to the results of this research, undermining the intensity of the connection of ecological networks by restricting the transmission corridors of infected mosquitoes, the spread of dengue fever can be effectively controlled. The three research objectives are:
- Employing ecological network analysis to detect suspected key transmission corridors for the movement of infected mosquitoes during and between each time period.
- Make the recommendation related to different key transmission corridors to curb the spread of infected mosquitoes.
- Adopt GIS software to integrate the analysis data and results and to display the information on the map.
As a result, the following aspects can be obtained:
Space-time diffusion of dengue fever.
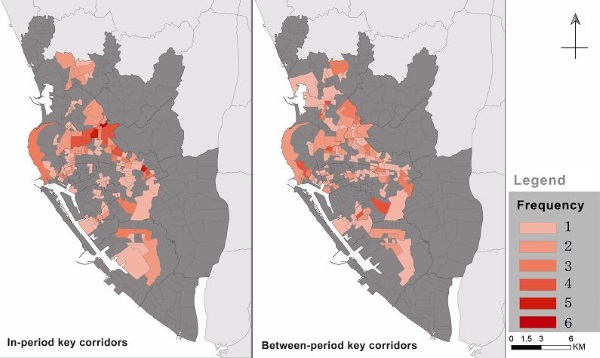
When it comes to the space-time spread of the dengue epidemic, human movement and the movement of infected mosquitoes is binding. Let us remember that the flight radius of a mosquito is not greater than 100 meters, so that the sources of infection are punctual; therefore its gradual spread. If the path can be detected, it can be restricted by external forces. Therefore, the key transmission corridors of infected mosquitoes can be detected and displayed with the GIS software, and the areas in which the corridors are recommended to be eliminated are also displayed on the GIS platform to control the spread of the epidemic. dengue.
Data source.
Relevant data from the Taiwan Centers for Disease Control was captured, analyzed, and displayed on a GIS platform to search for the main transmission corridors for infected mosquitoes. Subsequently, the recommendation was made for the elimination of these key corridors to jeopardize the relationship between the intensity of each habitat and to achieve the objective of preventing spread.
The Space-time Network for Habitats and the Movement of Infected Mosquitoes.
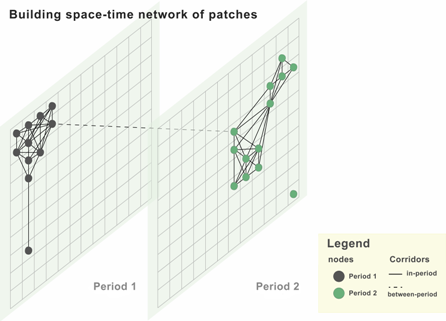
The space-time network is mainly made up of layers of nodes and lines, which belong to different time periods. Each node identifies the habitat where mosquito eggs are found, it is created in the center of the corresponding frame in the layer. And each line connecting two nodes represents the corridor of the two habitats in the mosquito's range of motion. Also, the lines can be divided into two types of link connecting two nodes in the same layer time period or different layer time period. A solid line represents the possible transmission corridor in the same period, as long as the two endpoints are in the same period layer. Meanwhile, a dotted line represents the possible transmission corridor through two periods, provided that the two endpoints are in different time layers. The ecological network of infected dengue mosquitoes is built according to the above principle.
Calculation of the importance of each link
The analyzes are employed within the ecological network definition and space-time analysis to define the meaning of each link. Furthermore, the identification of neighboring topologies will make it possible to define the vector mutation relationship.
Link types and attributes
According to the temporal characteristics of the links in the same or in different periods of time, and the results of the analyzes that include global link and local link. The bond is considered the most important of all. An isolated element is synonymous with the possible and key corridor of transmission of the movement of infected mosquitoes. In addition, the link in the same or different periods reveal different intensities of transmission risk. The superposition of layers of different types of links with the GIS Software, allows to visualize the main transmission corridor built both in the same and different periods.
In this case, the exercise was performed using SuperGIS Desktop
This is not new. We remember Doctor Snow's maps for the detection of dengue. In this case, the access we have to technologies differs and that instead of being sewage as in those times, it is a vector
For more information, you can see the Supergeo Technologies page.