
Testing the accuracy of Google elevation data - Surprise!
Google Earth provides access to your elevation data with a free Google Elevation API key. Civil Site Design, takes advantage of this potential with its new Satellite to Surface functionality. This function allows you to select an area and the distance between the points of the grid, it returns a surface with curves of level integrated with the Civil Site Design software and an aerial image.
Lance Maidlow of ChasmTech LLC built this case of use that was published in the TwinGEO magazine
I was always curious about the accuracy of the data provided by Google. There were two possible use cases that I had in mind:
- Conceptual / preliminary design for new subdivisions.
- Access to the topography of the basin for the analysis of floodplains with HEC-RAS 2
For evaluation purposes, I selected two sites:
- The 1 site was a very high subdivision in Dunedin, Florida. For this, I had originally downloaded and processed over 2 millions of LiDAR points from the NOAA website.
- The 2 site was a proposed commercial subdivision in Lake County, Florida, where we had survey data in a 100 grid, as well as detailed surveys of existing infrastructure.
The function satellite to surface, generated surfaces for the two test areas in less than 10 minutes each. Surfaces generated from Google's elevation data were surprisingly accurate when comparing LiDAR and survey data.
However, it would be extremely useful if Google provided the source and date of your elevation data.
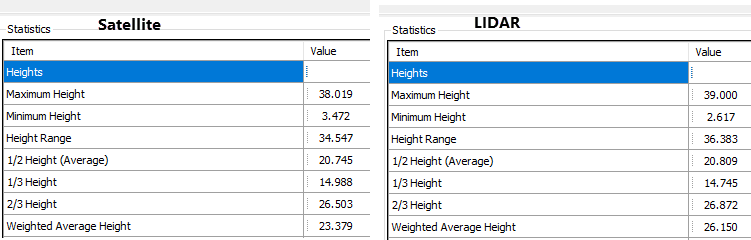
 The results are very similar, though, the original LiDAR points were 8.5 lower feet compared to the level of a known lake. This adjustment was added to the LiDAR data in Civil Site Design before the contours were created, as shown below in the detailed comparison of the surface data between the two sources. The average height of 1 / 2, 1 / 3 and 2 / 3 are practically identical. The weighted average height is 3 feet higher than that of the LiDAR data. This difference is attributed to the fact that the points are denser in open areas compared to areas covered by trees. The satellite data was generated in an 20 'grid.
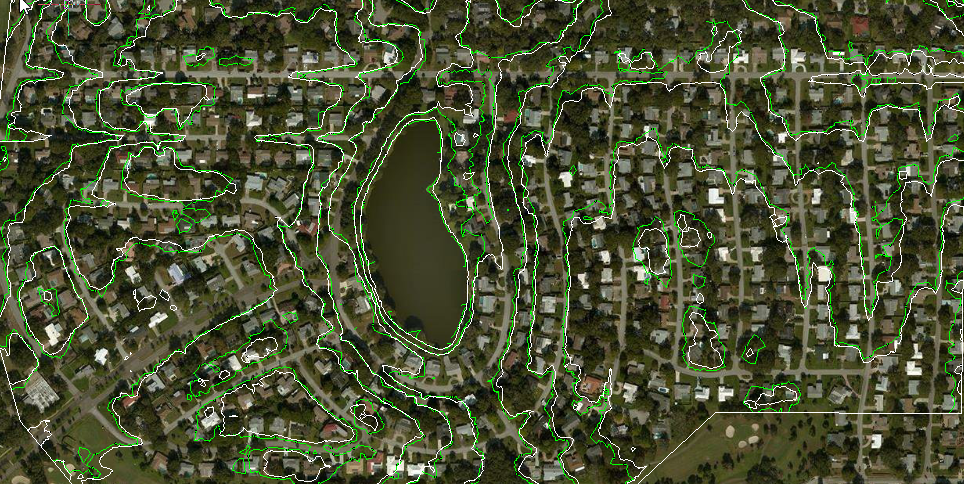
Next, a visual inspection of the satellite data is presented that compares favorably with the real conditions of the terrain.

In this particular case, a node had to be placed at the elevation of Google, in terms of raw accuracy and the general shape of curves in relation to existing roads and the location conditions of the houses.
Subdivision of Commercial Zone
In the following example of commercial subdivision, the contours were generated from an 20 'grid with satellite data, the red curves were obtained from recognition data in a 100' grid.

Local knowledge is, however, important since the elevation data does not have an identified date. A depression was completed and a reservation was created after they collected the Google elevation data. Similarly, a holding pond was built in the northeastern part of the site, after all the elevation data were collected.
The Source of Google's elevation data, vary according to your location. Although more information about Google's elevation data can be obtained from some sources, it remains a mystery.
Although this analysis is not scientific, it can indicate that Google Elevation data are acceptable and can be considered for the conceptual design of urbanizations or to generate a basin surface, which can be used for flood analysis with applications such as HEC RAS 2.


Good afternoon:
It is complicated to compare the goodness / precision of the altimetric data obtained by different sources.
The problem is in the calculation process / methodology by which the DEM or lidar data that are being compared have been obtained -> mesh step, Geoidal model considered, control points etc.
I will carry out a study in Spain to compare IGN's Lidar z orthometric, RTK GPS survey supported by high precision leveling and google earth -> on my blog I will tell what comes out….http://autodidactaengeomatica.blogspot.com/
Greetings and thanks for your contributions ...
Raul