
Manifold GIS creating layouts for printing
In this post we will see how to create an output map or what we call layout using Manifold GIS.
basics
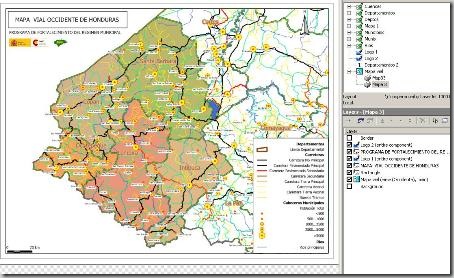
To create a layout, Manifold allows a dataframe, or as a map is known, to be nested, although it can be inside a folder or associated with a layer or another object that in Manifold is called parent. It is also necessary to have the printer and paper size configured so that depending on this the layout goes, in this case I have chosen a letter-size sheet in horizontal format.
The biggest work is in assembling the dataframe, where it is defined what layers will go, with what color, symbolism, transparency, etc.
According to the lower graph, to the right in the top panel are the data sources, the ones we want are in the dataframe (map) are dragged to the window and individually thematized.
Then in the lower right panel is the formation of layers (layers) of this dataframe (map) and here you can indicate the order that they can take, as well as the transparency. The same can be done with the tabs below the display that can be dragged to change the order or turned off or on with a double click.

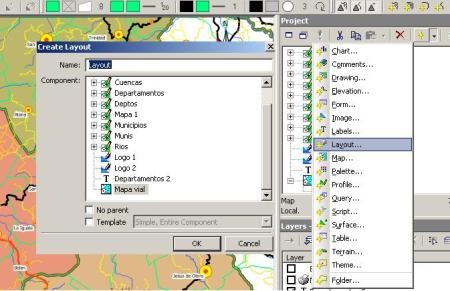
Then to create a new layout, mark it in the right panel as if you were to make any component and choose layout. Then a panel appears from which object will be the layout (parent), name and if we expect a template. It can also be indicated that it has no parent. In this Manifold falls short as it does not have enough templates like ArcGIS.
Customize layout
Then to customize, double-click on the created layout, and right-click on the framework. Here it is possible to configure:
- The scope that can be based on a saved view, a framework, a frame from a center point and scale, a layer, a selection of objects or a specific component.
- In my case, I'm doing it based on a saved view (view) which is basically an approach area defined as shortcut as gvSIG or ArcGIS does.
- then you can define the paging, because it is possible to define how many pages will be output as an array (type 2 × 3) and you can specify which ones we want to see individually.
- You can also define if you want the work background, grid, geodesic mesh, border, north, graph scale and other miquis to be displayed.

And here we have it without much return.
Customize objects
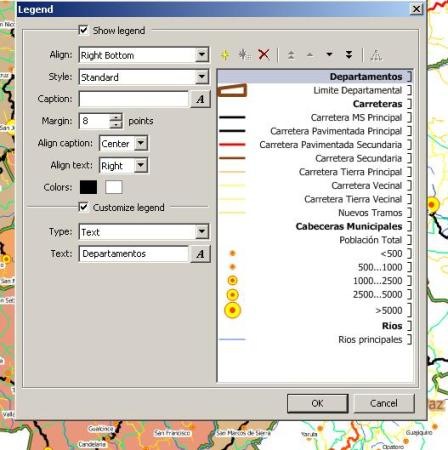
The legend is configured in view / legend, and there you define which layers will be labeled and if you want them ungrouped or not. You can also edit the names and whether the legend frame will be edge-aligned or loose.
In the same way the north symbol and graphic scale are configured.
For agre Add images, these are entered as components either linked or imported and dragged to the layout. To add other elements, they are selected from the upper panel that are displayed when the layout is open, they allow adding horizontal, vertical lines, boxes, texts, legends, north symbol or graphic scale.
To control the position there are tools to align, if they are moved manually they are touched with the ctrl + alt keys pressed and this shows a node that can be moved manually.
Export Layout
To export it, right click on the layout and export. It will be necessary to indicate the resolution of dots per inch (DPI) and if texts are converted to vectors. It can be exported to Adobe Illustrator (.ai), pdf, emf, and postcript.
Here you can download The file exported to pdf.
Practical?
At first glance it looks half taken for a ride due to the little help that exists in the manual oriented to “how to do it” but in reality it is very robust. A first confusion that happened to me was thinking ... "how do I add more dataframes inside the layout?"
Simple, any object that is in the project panel is dragged, it can be any inserted or linked component. For example, it can be an excel table, which is only linked, which implies that it can be customized in Excel to taste, then it is only linked and dragged to the layout.
Each of the dragged objects has its own customization as I explained above, its coordinate frame etc.
Compared to Arcview 3x, this is very robust, but when compared to ArcGIS 9x it falls short of "conventionality" because you have to understand the different way of thinking of its designers. Although ArcGIS is limited in some aspects such as the number of layouts that can be created associated or not associated with a dataframe, the presentation quality is very attractive, apart from its pre-designed templates and some extras such as rounded corners in what Manifold is crude.
For now, with how good Manifold is in other juggling, deferred in practicality.


