
How to georeference a scanned map
Earlier we talked about how to do this procedure using Microstation, and although it was a lowered image of Google Earth, it is applied equal to a map with defined UTM coordinates.
Now let's see how to do the same procedure using manifold.
1. Obtaining Control Point Coordinates
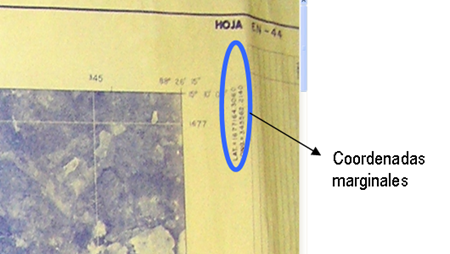
It requires at least four map points with known coordinates ... eye, and with a projection also that could well be NAD27, WGS84 or other. Generally these coordinates are in the corners like the image below.
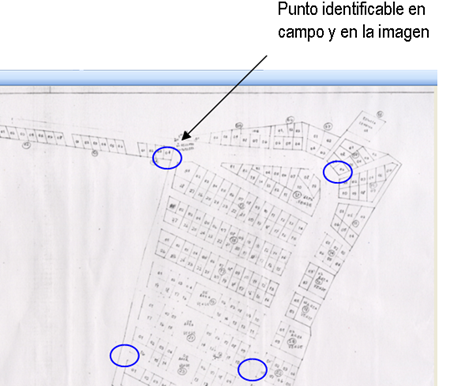
In the case of a map that does not have coordinates, these can be taken in the field with a GPS, using clearly identifiable points. In this case I used a Thales Mobile Mapper base and another to capture the points after differential correction have done with Mobile Mapper Office and the accuracy of the points is submeter.
 Once the data is obtained we store it in an excel file, with two columns, one for coordinates x (lengths) and one for coordinates and (latitudes)
To import the image to Manifold from usa file / import / drawing and select the scanned image.
2. Import Control Points to Manifold System
From Manifold we select file / import / drawing and select the xls file option, then find the file.
![clip_image002 [4]](http://geofumadas.com/wp-content/uploads/2007/11/clip-image00243.jpg) A dialog box appears, you must select the columns that contain the data of interest.
A dialog box appears, you must select the columns that contain the data of interest.
Columns: keep the check in the columns X 'and Y', in the others remove the check.
X / Longitude: X '
Y / Latitude: Y'
Now press Open, and the table is automatically imported into the manifest file.
3. Assign projection to imported data
In the Project window we right-click on the newly imported drawing (ends with *Points drawing) and in the displayed menu select Assign Projection. Configure the Coordinate System in this case we will use UTM zone 16N, and datum WGS84.

4. Creating control points.
Access the menu "Tools / Customize" and a dialog box is displayed where we select the box corresponding to Control Points and then Close.
On the right side of the screen the Control Points, click on the tool New Control Point, and we located each control point with the help of Snap to Points, this in the case of the map whose corners we knew.

In the case of the map from which we have taken points with the GPS, we import the DXF file with the option File / import / drawing and we select the category dxf files. The rest is similar to the previous step, always assigning projection with the steps of point 3.
5. Georeferencing the scanned image
To import the selected image file / import / drawing by choosing the option jpg files, or format having our image. Then we add projection following the steps of point 3.
Now open the image by double clicking on it, and select the tool New Control Point, marking each point in the same location as the points indicated above, and exactly in the same order in which they were assigned on the map.
![clip_image002 [6]](http://geofumadas.com/wp-content/uploads/2007/11/clip-image00263.jpg) Now in the Control Points box we select Sign up, y in the displayed box we check the following parameters:
Now in the Control Points box we select Sign up, y in the displayed box we check the following parameters:
- Reference: Mosaic
- Method: Affine (scale, shift, rotate) then press OK
To save the image in a georeferenced format, you just have to right-click on it, and then export. You can save .ecw format that is fairly light.
Of course, the best way to georeference a google image Earth (or Virtual Earth, or Yahoo maps) with manifold is stick directly to image service ... and you save all this battle.


When importing more than 50 points to the manifold to generate contour lines, the manifold only puts the points and a circle around them representing the curve and most of the plane leaves it in a single interval ...... you have to modify some option to that I can generate the curves in a better way and how can I change the maximum and minimum heights when generating the contour lines ??????
I am scanning cadastral maps to georeference them later, they are at scales 5000 and 10000 occupy MS Descartes and ERDAS, at the time of doing the resampling in both is the option to set the pixel value, to those scales what should be, if someone has a formula Clear, thank you,
With Microstation from the 8.9 versions you can call it as if it were an image and georeference it as is explained in this post.
Thank you very much for posting this. But I would really like to ask you a question, if you would be kind enough to answer it, how can I “georeference” a map in pdf format” knowing several points in latitude and longitude?
What happens is that it will be difficult for you to hunt well, for the curvature of the earth that on that scale affects an image with only four corners. I suppose you want to make her hunt with a map, which was surely created using a more accurate scale, where the curvature of the earth is considered.
Does the image weigh a lot to get a look ?, or even if you send me a print screen of what is happening on the AutoCAD screen.
Editor (at) geofumadas (dot) com
THANKS FOR THE COMMENT G !, MAYBE I EXPRESS MYSELF ABOUT THE AREA ISSUE, WHAT HAPPENS IS THAT I HAVE TRIED TO GEOREFERENCE THE MAP OF PERU WITH THE RASTER DESIGN, USING THE FORMAT YOU INDICATE FOR THE GEOGRAPHICAL COORDINATES, CLEARLY CONSIDERING NEGATIVE BE TO THE SOUTH AND THE W, BUT IT HAPPENS THAT USING FOUR POINTS THE IMAGE DOES NOT ADJUST TO THE ESTABLISHED COORDINATES IN ITS TRUE POSITION, THERE IS A DISCREPANCE, MAYBE THAT MAY BE RESOLVED BY INCREASING POINTS, BUT IF IT IS INQUIRY TWO MERIDIANS IN THE AUTOCAD MAP I AM VIEWING THEM AS TWO PARALLEL LINES, WHICH DOES NOT SEEM CORRECT TO ME (CORRECT ME IF I AM WRONG)… I WOULD LIKE TO UNDERSTAND HOW AUTOCAD MAP WORKS THE GEOGRAPHIC COORDINATES,
THANK YOU.
In geographic coordinates there is no spindle, so that does not affect. The coordinates could be of the form: 87.7890, 15.654
What is required is that the format of work units be in geographic coordinates.
HELLO I NEED TO KNOW HOW A GEOGRAPHIC COORDINATES IMAGE CAN BE GEOREFERENCED IN AUTOCAD, WHERE THE IMAGE TO GEOREFERENTIATE CONTAINS MORE THAN ONE USE, LIKE THE CASE OF PERU THAT HAS THE 17, 18 AND 19 ZONES.
GREETINGS
Hello Lorenz, I commented that in my case, I usually prefer to use Microstation Descartes to treat images, because Manifold is very limited if you want to do more than just stretch images
First thanks for the interesting article you are posting, I think it is an important alternative source for many Manifold users (who speak some Spanish).
I have been using Manifold for a relatively short time and I am a bit disappointed with the image georegistration process because it does not allow to show the residuals at each point or the RMS of the transformation before registering it, which is often required to check the quality of the points of selected control (well, in the manual they say that you can make a surface and then with transfer heights remove the residuals and then manually calculate the RMS ...).
How do you solve this Manifold deficiency (eg in the cadastre project in your country u in others)?
regards
Where can I get the software for the GPS Mobile maper ce Thales