Generate technical memory of plots with CivilCAD
Very few programs do this, at least with the simplicity that it does CivilCAD

What we usually expect is a report of the parcels, by block, with their table of directions and distances, boundaries and use. Let's see how to do it with CivilCAD, using AutoCAD although it also works with Bricscad which is cheaper and works in the same logic of AutoDesk:
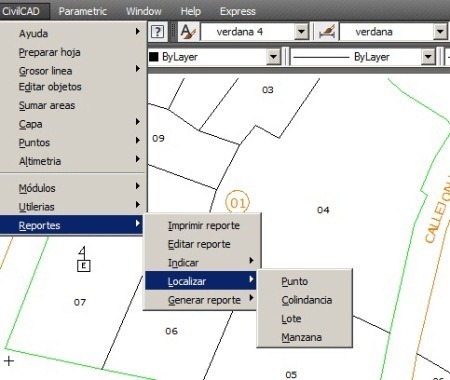
The routines that I am going to show are used from the Reports menu, it is at the bottom of the bar that I have cut out for the purposes of this exercise. It basically allows three important aspects: Define the objects, locate them once defined and then generate the reports; As for objects, it allows working with points, boundaries, lots and blocks (although the latter do not exist graphically but are an attribute of the properties and their extension is the sum of these)

1. Indicate external boundaries
For this, the menu is used: CivilCAD> Reports> Indicate> Adjoining
 Then what we do is touch the boundaries of the block that adjoin the main street, then we do Enter and write the border. The signal that has been processed is that they change color, passing to the layer called CVL_COLIND. Quite similar to what Microstation Geographics did Assigning attributes, Although there is no database here.
We do the same with the boundaries that adjoin the other street, in the case of example:
- 11 STREET
- AVENIDA MEMORIAL
- CALLEJON LOPEZ
This is what creates an attribute to the objects, associated with the name of that neighborhood.
To see the adjoining, it is done: CivilCAD> Locate> Adjacent. We write the boundary and the map display will focus on the entire length of that boundary, just as Bentley Map does with the geolocate. For each of these routines there is a text command, the case of this one is -LOCCOL.
2. Indicate the plots and blocks
To indicate which are the plots, it is done with: CivilCAD> Reports> Indicate> Lotification
 A panel is raised where we choose the criteria for labeling the lot: the size of the text, if we want you to write down the number of the property, the block or use. As it is a self-generation process, you have to define what the initial number is.
The signal that is being processed, is that a closed polygon is created that is located in the layer CVL_LOTIF.
This process has slight limitations, among them, that it can not place 01, 02, 03 numbers ... but it places them as 1, 2, 3, so if the Cadastre manual states that two digits must be used, they must be edited.
But in general the command is great, it is not necessary that the boundaries are generated, the lisp makes them using the BPOLY command, obviously you have to zoom in so that it does not take too long because this command in AutoCAD makes a scan of the entire visible area and it can be time consuming with a very large display. It also causes problems when there are rounded corners or splines that are not easy topologies for work from CAD.

It is obvious that for this process it is required that the map has Topological cleaning, if not, it will generate erroneous areas. If a property has been mislabeled, in the wrong order or if we have made modifications to it, only the polygon is deleted and it is rebuilt, since the attribute is in the shape. Each shape is associated with its extent, property number, block and use.
3. Indicate the points
For the system to generate the nodes of the subdivision, it is done: CivilCAD> Reports> Indicate> Point
The panel that is raised asks us if we want to generate points individually or by block. We can also choose the point format, text size and what number it starts with.

Simply impressive, we are asking what apple we want to generate points, and the system does a process in which it analyzes all the nodes in which the generated boundaries are intercepted, creates them a point, labels them and makes them an attribute with spatial association of such Way that you can later find again with the option: CivilCAD> Reports> Locate> Point.
All generated points are saved in the layer CVL_PUNTO and the annotations in CVL_PUNTO_NUM
In the same way, an apple or a lot can be located, although in practice it is not so simple if the numbers are repeated. It will depend on the cadastral nomenclature system, many allow the repetition of blocks in a different quadrant map and obviously the property numbers are repeated for each block.
3. Generate a technical or descriptive report.
Here comes the best. CivilCAD can generate different reports such as:
- Summary of Areas: This first summarizes the blocks, indicating the area dedicated to each use for each property, then below the summary of uses in each block and finally the summary of uses for all the selected blocks or the entire associated map.
- Points Report: This generates a list that includes four columns: the point number, the X coordinate, Y coordinate and elevation.
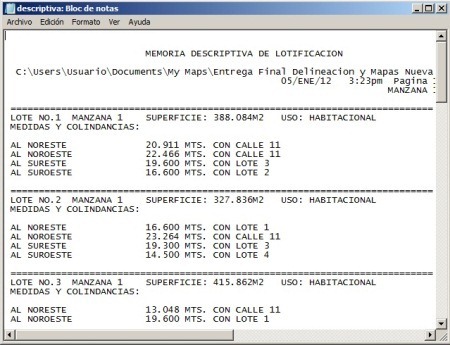
In the case of the Descriptive memory. If we request that block, the report is generated indicating the name of the map, the date, and then one by one the lots are described with their calculated area, use and boundaries as seen in the following image. See that the system does a common boundary analysis, so it calculates not only who the lot adjoins the outside, data it obtains from the block boundary but also who it adjoins the inside of the block.

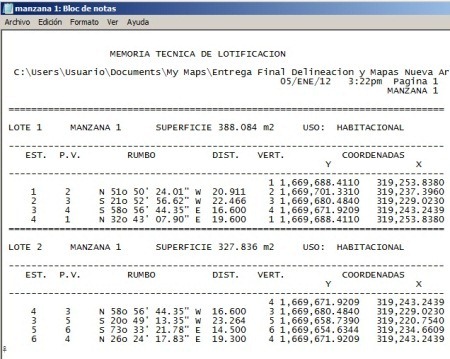
If I want to generate a type report Technical memory, the table includes for each lot: the boundary stations, the bearing, distance and coordinates of the vertex. Also the area, use and this is iterated for each property of the indicated blocks.

There is another report that is a combination of both, but because of the way AutoCAD manages the memory it is not advisable to execute massive reports if they are many the premises because it can generate us a fatal error to the collapse the memory.
In conclusion, not bad for a CAD program. It solves common routines in the design of urbanizations or cadastral management.


how to make descriptive memories and summary of areas generated by the civilcad is drawn on a table in the autocad and not exported to Word.
The Descmaster is good but it is of payment, I have just finished a similar one for free
https://www.youtube.com/watch?v=tRg8YNSpBpU
Hello Byron, if you could send the program or information to this email
Dubal_tcons23@hotmail.com
Hi, I have the Descmaster program.
James Linares and where I get this program Descmaster, I could only find a manual to see on the internet. But there is no program, if you could give me information on how to get it would be very grateful ,,
I'm a cartoonist, greetings from Peru
They should try the Descmaster, which is good enough to perform the Technical Description used to make the Scripture.
This program was carried out by Mr. Jaime Ramirez from El Salvador