
3D Web data modeling with API-javascript: Esri Advances
When we see the ArcGIS Smart Campus functionality, with tasks such as paths between a desktop in the third level of the Professional Services building and one in the Q Auditorium, as a result of both the interior cadastre and the BIM data integration, we give ourselves The integration of Geo-engineering flows into a binding vision is very close.

And despite the fact that there are serious tasks missing to maintain a master data management (MDM) type method for a point of truth between the light reality of GIS, the detailed reality BIM and the application incidents in real life that run on this pointer. We also realize that all this functionality is running on web browsers, with some Python for routines but especially with a language as light as javascript.
What inevitably reminds us, that geomatics and engineers will have to go a step further to understand models, and programming codes.
It's also important to note the trend shift from heavy desktop environments to lightweight browser snippets. Surely a computer scientist who made art with GIS server, Gis Engine or Gis objects went out of business when he saw how Leaflet worked in a course on MappingGis; I would not be surprised if he went to jump over the grave to his predecessor mentor.
Pending the next ArcGis Indoors version, this article summarizes a combination of Lau's insights - a tenacious girl who collaborates with this site - and the context views of the editor of Geofumadas.com, on the recent webinar “An introduction to 3D on the Web with the ArcGIS API for Javascript ".
The exhibitors of the webinar initially appeared with a good hook on the subject of using 3D in ArcGIS applications, and how it manifests itself in the platforms of: Scene viewer, Story Maps, or the Web App Builder depending on the purpose of the study.
It was important that the basic concepts related to the 3D topic be defined from the outset, especially because beyond showing volumes, it seeks to model processes. Also the aspect that is still critical in terms of basic system requirements to run processes linked to this type of data that are completely different from 2D, such as a good graphics card, OpenGL support included in the browser w / WebGL.
If not, let them be told by friends of SELPER, in the magnificent course of asset management in GIS technologies, which had its barriers before the OpenGL versions of the Nvidia graphics cards of the University where it was developed. Increased exponentially by the protests of Bogota students that made it difficult to do enough tests the day before.
In addition, they revealed the launch of support to run the tool on mobile devices such as cell phones or tablets.
In the presentation they made several examples or demonstrations, to understand how the API for Javascript works and how the data is interconnected to generate the 3D modeling, starting with the loading of layers or information to the WebScene and later its 3D modeling / rendering in the Screeneview,
Technological integration
The architecture is of type 4.x and is made up of visual components and widgets, in addition to accepting multiple layers of information from different data sources. This architecture excels over 3.x because 3D visualization is only available for this level. The Webscene and SceneView tools are used to manage 3D data and are fully integrated into the API, in addition to how 3D modeling can be adapted to the data available in previous applications.
With examples, they indicated the visual difference between 2D and 3D data and how to go from a 2D WebScene map view to a 3D SceneView, through javascript codes. The manipulation of the camera is simple, adding some specific commands the views change the direction. Tests were carried out on the following characteristics:
- heading, that allows the rotation of the camera on the workspace.
- goTo: is used to establish a view according to what you want to see in 3D, plus you can make animations with this tool, such as placing certain degrees of headings to recreate a rotation animation.
- ToMap: takes coordinate of the view and places it on the 2D map
- toScreen: allows you to indicate a point on the 2D map and place it later in the 3D view
- hitTest: is used to determine the characteristics that a specific point has within the view
They also defined that the construction of an 3D map has the same tools as to create an 2d, such as the use of basemaps, layers or layers that are supported as well as for 2D maps (WMS, vectors or CSV).
 However, it must be taken into account that the 2D layers do not contain the information of "Z" (height), that is why to model data it is necessary to have layers associated with 3D as point clouds, meshlayers: elevationlayers. Within the API, you can make inquiries about these 3D layers, such as specific elevation points within the view, in the image (1) the terrain is originally observed, and in the image (2) as it changes from the Query or consultation made.
They showed multiple examples of how data is represented, for example, what data is supported by SceneLayers (points), and 3D objects (3D Objects).
For large cities, the representation of 3D objects is a powerful tool, since it is possible to see, not only the spatial location of the object, but its volume, relationship with the environment, as well as the intrinsic characteristics of each of them can be added. the objects. The following image shows how they randomly selected a building in New York City, and all of its attributes can be seen. Likewise, multiple queries could be prepared according to the structures, such as: where certain structures that have a specific height range or definition of optimal routes are located
Supports the handling of layers like IntegratedMeshLayer, which is a block of information from sensors like drones. They do not contain isolated information of each structure like the previous image, but it is a mass of information with 3D attributes.
As for the point clouds, you can play with the size of the points to have a better visualization of the data, since each point layer can have billions of information points, but they are not represented as an 3D object itself.


They specified the use of symbology in 3D data, which is presented in flat / flat shapes, and the volume symbology associated with objects created in 3D. These can be in specific styles according to the type of object. They showed the use of so-called Extrudes to “color” the structure according to its attributes,
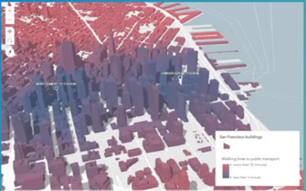 The types of render that can be used were shown: simplerenderer, where all the objects have a single symbology, the uniqueValueRenderer where you can categorize the objects, according to an attribute, and the ClassBreakRenderer where attributes of each object are observed with respect to a class: in this case they indicated how much distance from the building it takes to access the public transportation system.
The presenters, showed in the short time sel Webinar, all the benefits of using the ArcGIS API for Javascript, including:
- 3D widgets: with an interactive demonstration they indicated the distance between objects, both horizontally and vertically.
- Construction of applications: from the location and the 3D objects.
- SceneView scene mode: defines the content and style of the 3D view and can be uploaded to Portal for ArcGIS.
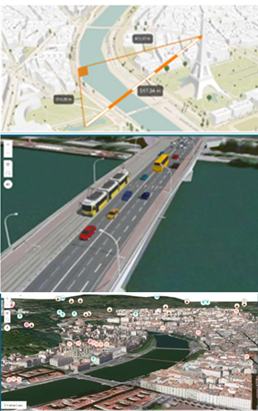 Geodesic measurements: not only focuses on the structures of the surface, but also allows to measure distances in the globe.
- Application building, 3D modeling according to the reality of the space, lines or bubbles where certain features are indicated, such as the tags that can be seen on platforms such as Google Earth, in this case 3D
- Declutter: used to debug or filter which labels or features are what you need to see on the 3D map, thus avoiding a large number of labels that do not allow an appropriate visualization, and cause noise when placing something in specific.
Following the demonstrations of each characteristic incorporated into ArcGIS API for Javascript, showed the novelties to be presented in the new 4.10 version. Where you will have the possibility of:
- Build the Scene Layer
- Slice widget: which will transmit previously designed information to an 3D object
- Loading a large amount of data: not only corresponding to a specific city, but nationally (country).
- Point cloud filters
Contributions of this webinar to geoengineering
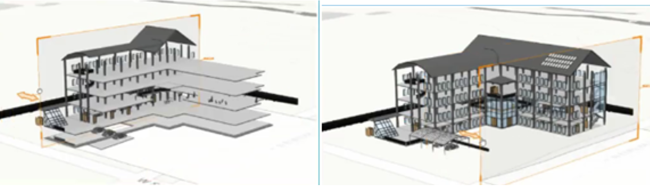
In short, the subject is very valid; remembering that the trends towards Digital Twins and Smart Cities require that, beyond thinking about information management, whose modeling has been greatly surpassed, integration with operation modeling be addressed. The market is wide, promising and to date it already has many almost turnkey solutions for the end user; although for those of us who use technology to make non-canned tools, the road is still hard. This implies, converge the other dimensions such as time, cost and life cycle of the processes; not at the level of data and technology, which, as we insist, is a clear issue, but rather in the less painful adaptation to the user's real life actions before intermediaries in the transactional chain that pass through spatial information. From the ESRI side, data construction is somewhat arduous, because although you can already integrate BIM data built on Revit, it is still seen as two separate worlds that require complex transformation. The new works will surely be able to be used on BIM models, but there is an excessive amount of CAD information that to bring it to Indoor conditions, with polygonized spaces, elevations and normalized layers is still expensive.
However, if Esri deserves credit, it is the progress it makes in terms of attractive and simple visualization. I can already imagine the disappointments of Mr. Jack, with his optics of "let's make it easy" the vertical line leaders of AutoDesk, in that late but successful marriage where "almost an ArcGIS Pro application” must find under the sheets as a fit with several pieces that point to the same thing but with difficulties to simplify the essence of the result sought by topography, Industrial Engineering, Civil Engineering and Architecture. And it is that the trend of simplicity of the artistic map that GIS suffered, must still be lived by conventional CAD, due to that habit of forgetting that a plan is just a medium, but that the important thing is to put the building into operation.
The good practices of modeling GIS, lightweight, focused on the abstraction of reality will be useful for the CAD / BIM hybrid, which for a time must coexist because the adoption of BIM in many countries goes for long, especially due to the normative ineptitude of old-fashioned officials pasted on the first two letters of the AECO vision.
The race will be interesting in the coming years, in a very similar trend to bring to a continuous flow the sequence CAD-GIS-BIM-DigitalTwin-SmartCity; as evidenced by actions on the side of Siemens / Bentley in the acquisition of solutions such as CityPlanner and the release of open source on Javascript.
For now, let's give Esri credit for that synergy effort with AutoDesk, beyond data / technology integration, in a process / actor integration approach. In the end, it is a gain for the users, who are left to guarantee that step to learn to understand models and code; to start at least a good ArcGIS Pro course and a Javascript basics.


